Data Visualization for Contra Costa Community College District
Data Visualization for Contra Costa Community College District
Challenge
Contra Costa Community College District (4CD), one of the largest multi-college community college districts in California, had invested in a data visualization tool for sharing key performance indicators related to student enrollment, retention, and program review, but struggled to increase adoption. Among the small pool of existing users, few were seeing real value from the data. Like many higher ed institutions embracing data and analytics, 4CD realized that the technology investment alone wouldn’t enable staff to find meaning in the data and make more informed decisions. They needed to modernize their reporting environment and improve user engagement, communication, and data storytelling.
Solution
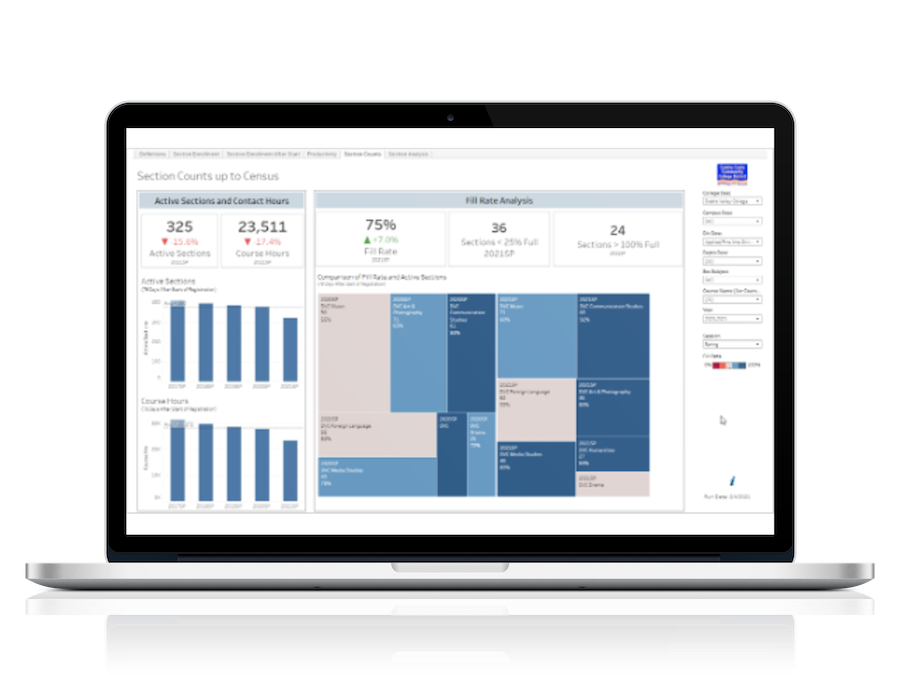
After updating 4CD’s system architecture, Voyatek developed a high-level strategy for designing outcomes-focused visual reports for institutional leaders and department analysts. Voyatek engaged with multiple campus groups to develop dashboards for key institutional initiatives (e.g., Program Health, Zero Cost Textbooks, and Learning Communities) using a joint application design (JAD) approach.
Our JAD methodology helped 4CD identify broad analytic objectives, define specific business questions, and use the new dashboards to uncover insights that they immediately translated into meaningful action. To further increase user engagement, we also redesigned existing reports to leverage visualization design best practices and conducted multiple power user training sessions.


